Using Astrology to Trade - Good or Bad?

June 9th, 2006

We have been following the market predictions of Yogi lately to see if there’s any value in “trading with the stars”, otherwise known as Astrotrading. It was predicted that the market would retreat at the end of May and be impacted by some world event by around today (9 June 2006).

Let’s have a look at the charts to see how accurate the predictions were:

XAO chart over the past 6 months

Well it seems there was no major retreat at the end of May as the retreat was already well underway and didn’t get much worse. The original post was on 10 May 2006 though - the high point you see on the chart above. So kudos to Yogi for picking the retreat even if his timing was slightly late (he still predicted it before it happened).

The other impressive thing is that a major world event did indeed happen around the 7-8 June as Yogi predicted - the death of Abu Musab al-Zarqawi. It didn’t have a huge impact on the Australian stock market but it may influence the American market more tonight.

So once again I’m stuck in limbo as to whether or not astrotrading should be considered as a viable trading method. What do you all think? :)

Web Site Stock Market Simulator

June 7th, 2006

Did you hear the one about the guy who sold his web site for millions? You’ve no-doubt heard the stories. The ones like Hotmail being sold for over $400 million. Or, closer to home, Trade Me being sold to for around $700 million. If you think you know the next big web site you can now prove it at alexadex.com.

So what exactly is Alexadex? It’s like a stock market simulation or a stock market game where instead of paper trading equities, you’re pretending to buy and sell web sites. But how is the value of a web site determined? That’s a rather subjective point, but here’s how Alexadex does it: Read the rest of this entry »

OSH - Hitting the 30 week moving average

May 23rd, 2006

Yesterday Oil Search Ltd (OSH) dropped down very close to its 30 week exponential moving average (seen below in aqua). Looking at the chart over the past 2 years, OSH consistently bounces off this 30WMA. If it were to break below this line, it would be a strong sell signal.

If the market were strong, this would be the perfect time to buy. However, your chances of profiting from a continuation trade like this are much greater if the market (and in particular, the sector the stock sits in) is trending up. The market has performed extremely poorly over the past 2 weeks. This could cause OSH to struggle to return to the $4 mark let alone $4.50.

The previous all-time high for OSH was $4.48, back in September 1997. The stock managed to break this resistance level briefly in the last couple of months and reached as high as $4.58. Since then it hasn’t been able to sustain above this level for very long. Proceed with caution (read: a stop loss).

OSH - Oil Search - 22 May 2006 - 30 Week Moving Average

Astrotrading Flawcast?

May 23rd, 2006

Well it seems Yogi wasn’t too accurate with his 10 May stock predictions. Instead of the expected “strong DOW on both Thursday and Friday” (the 11th and 12th), we saw some of the largest falls we’ve seen all year.

It was also stated that the “XJO may not perform as well, as we look for XJO to trade flat-to-down (?), then rally again around 18052006.” This didn’t eventuate either with another huge drop on the 18th.

However, there is still hope that the final prediction may prove to be true:

“Next XJO high will likely be about 24-25052006 and then, 26-29052006 will likely see our first taste of a retreat from the highs(???), ahead of our next critical day for world events ….. 07-08 June 2006 (???)”

We’re back!

May 11th, 2006

After a longer than expected delay, Stock Trader is finally back! We’ve changed the look of the site and have been working hard producing some great content that you’ll see appearing over the next few weeks.

You’ll also see regular updates including hot stocks and the best tips and tricks. You can even join in and write articles to help your fellow traders too!

Plus, we’re also looking to launch a forum. We’d love your thoughts on this and any other improvements/suggestions.

Until next time, happy trading :)

Astrotrading Forecast

May 11th, 2006

The jury is still out as to whether trading based on astrology actually works, but I found the following post from Yogi in his starcode_traders group interesting:

Posted on 10 May 2006: 

Hi folks,

As targetted, in our 23032006 post:

XJO … today, we reached out 5386 target
from 13 March 2003 lows, at 2693.

Actual high today has been 5406, but it very
quickly pulled back to trade around our 5386
target ….. so, we have seen this market
DOUBLE in value in 1155 days.

=====

Expecting a strong DOW on both Thursday and
Friday this week, however XJO may not perform
as well, as we look for XJO to trade flat-to-down (?),
then rally again around 18052006.

Next XJO high will likely be about 24-25052006
and then, 26-29052006 will likely see our first taste
of a retreat from the highs(???), ahead of our next
critical day for world events ….. 07-08 June 2006 (???)

—–

Today 10052006, is also exactly 180 days ahead
of our target low, on 07 November 2006 … ???

Let’s see, how this lot unfolds.

happy trading

   yogi

P.S. ….. more about the similarities,between 1987 and 2006, later.

:)

Yogi seems to do well with his trading, but I’ve never spent time researching the accuracy. Even though there’s no logical explanation, I do value time analysis of stocks which he does very well. It will be very interesting to see whether the XJO retreats toward the end of the month. Even more interesting will be the big world event scheduled for the 7th or 8th of June.. Perhaps the event is a little earlier.. maybe the 6th of June? ie. 06-06-06.. or 666! Now that’s an evil sounding day! :D

Let’s hope Yogi is wrong about similarities between 1987 and 2006, but if he isn’t make sure you all have your stop losses in place.. :)

Selling an Aussie Icon

March 10th, 2006

On the day before Australia day I did a terribly patriotic thing (not). I sold my entire position in Qantas for $4.02. After brokerage, I came to a net loss of $20. As I write this article, 2 days later, the stock is trading at $4.07 and could go higher over the next few weeks. (edit: I started writing this article on 27 Jan 2006 but only managed to finish it now - months later. QAN has continued to struggle to venture much beyond $4 and now, as I finish the article, it’s trading at $3.90) So why did I sell my position?

As mentioned in my previous article about QAN, I bought the stock when I knew nothing about trading or investing back in 2002. I watched the price tumble to go below $2 due to the fact that I didn’t have a stop loss in place. This was a stock I really wanted to get rid of.

So what has taken me so long to close my position, and why have I closed it with the potential the stock might rise further?

For starters I wanted the capital to invest elsewhere. Sure, I could have held on, but why hold on to something that might make 20% in a year when there are stocks that could make 200% in a year (or two)?

When you consider the stellar run the market has had last year (and so far this year), QAN has been rather stagnate. Part of this can be attributed to the rise in oil prices and the threat of losing monopoly routes, but whatever the reason is I must force myself to analyse this technically and not emotionally.

The clincher for me was there’s been no significant increase in volume accompanying any breakouts. If a stock is going to do something big, you’ll see a large jump in volume prior to the real big price movement. With QAN, when you ignore the volume jump that occurred when British Airways sold their holdings, there weren’t any significant jumps in volume. There was no ‘buzz’.

Remember: Always look for a significant jump in volume to confirm your prediction that a stock is ready to break out or break down.

New Site Development

March 10th, 2006

As you can see there hasn’t been much action on the site since its launch. There have been a number of factors including a redesign which you can expect by the end of March. Upon this relaunch we aim to update the site at least once a week with some new authors coming on-board. If you would like to write for us then simply register and post.. it’s that easy :)

Other developments in the pipeline include an online, automated stock finder that will scan for stocks that are about to break out or break down. The main limitation we have had here is sourcing a good feed of historical stock prices. This stock finder will only be in beta release toward the end of the year, but the algorithms are so exciting that we thought it should be mentioned now.

So for now, feel free to post, comment, and make Stock Trader the educational resource that you want it to be. Even if you’d like to ask our thoughts on a particular stock simply register and post and we’ll reply right away.

Thank you 8)

Qantas - ready for takeoff?

January 6th, 2006

Qantas (QAN) was the first stock I ever bought. I didn’t know much about technical analysis back then. I thought fundamental analysis was where it was at. To me, Qantas was the perfect stock to buy. A great Australian company with little competition - the perfect stock to buy right? Wrong!

I bought QAN back in 2002 just as it fell below the $4 mark. That was my first mistake. Round numbers are magical things in the stock market. They often represent floors or ceilings (read: support and resistance), depending on which way the trend is going. I thought QAN would find support at $4. Instead it broke through the floor and plummeted down and down… until now.

It’s taken just over 3 years for QAN to return to the price I bought it at. And yes, I still hold a position. Why would I keep hold of a losing stock so long? Simple. Because I didn’t know any better. By the time I learnt I should stop my losses those losses were too great - and QAN was still returning some nice dividends that were comparable to the interest I’d have earned having that money sit in the bank (ie. around 4-5%).

As I write this article QAN sits at $4.05. If I closed my position now I’d do a little better than break even (after brokerage). It’s very tempting, but maybe there’s more steam left in QAN..

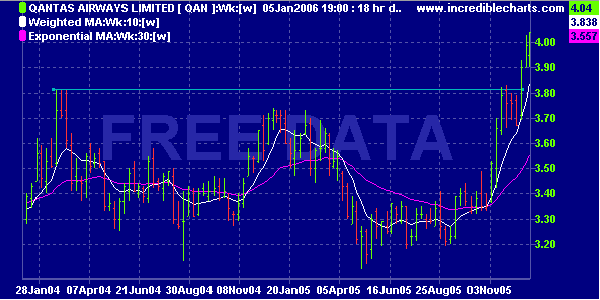
QAN - Moving Average Chart 06-Jan-2006

Moving average fans would certainly like the recent price action as shown in the chart above. I quite like it too.. :)

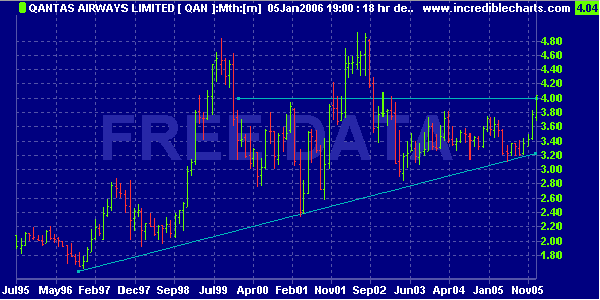
QAN - Upward Triangle - 6-Jan-2006

This rising triangle would also seem to be a good indicator.. a verybullish sign indeed.

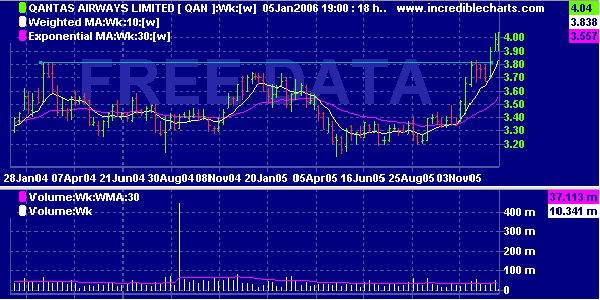
QAN - British Airways Volume Spike - 6-Jan-2006

This chart doesn’t tell much but for those of you looking at QAN charts it should be pointed out that the large volume you see during September 2004 was simply British Airways offloading it’s position in Qantas. If there was a volume like this during normal trade it would be considered a very important volume indicator.

Conclusion

Despite fairly positive technical signs, I think QAN may still struggle to break into blue sky territory (ie. it may have problems breaking record highs or even struggle to get through $4.80). For now though, I’m going to ride the trend as far as possible with a stop loss not that far behind.

As always, remember these are simply personal views aimed at helping educate and do not represent financial advice in any form.. :)

Learn to Lose

December 19th, 2005

In life, you have to learn to walk before you can run. In the stock market, you have to learn to lose before you can truly win.

Sure, your first trade may be a winner, but to consistently make money in the stock market you have to learn how to lose. More to the point, you have to learn how to cut your losses.

The majority of people who dabble in the stock market see themselves as smart, educated and sharp. Self-belief is great. The most successful people in the world have a strong belief in themselves. Some of the most unsuccessful people in the world also have a strong belief in themselves. So what’s the difference between the successful and the unsuccessful?

One major difference between successful traders and unsuccessful traders is the ability to admit when one is wrong. A successful trader will cut their losses before they get out of hand. An unsuccessful trader will let their losses grow in the false belief (hope) that things will pick up.

It would be nice if every stock pick was a winner, but when you get the odd loser you better make sure you cut that baby lose before you lose some big dollars.

The Stop-Loss

Before you even consider entering a trade, you should determine your stop-loss point. Your stop-loss point should be set at a price that you’re willing to sell your stock at should things turn bad. The price you pick will vary depending on your financial position and the particular stock being considered.

You may want to set a stop-loss exactly 8% under your purchase price, or you may want to set it just below some clear resistance in a chart (if the stock falls below the resistance level, you can be fairly sure things will continue South for a while). The most important thing is to test your system. If you set your stop-loss too close, you’ll never be in the game when the stock turns good. If you set your stop-loss too far away, you’ll end up losing too much money.

Remember, the main aim is to make a profit across your entire portfolio. Imagine you owned $1000 worth of 5 different stock. You set a stop loss at 10% current market value; so if the value of a single stock drops to $900 you’ll sell at that price. Even if you are wrong with 3 of the 5 picks (a $300 loss), you only need to make 15% on the remaining 2 stocks to break even. What if those remaining 2 stocks made 50% (which is very realistic if you pick your entry right).. You’d actually profit $700 across your entire portfolio despite the fact 60% of what you picked were duds! 8)

Starting with 5 positions worth $1000 each: $5000
3 losing stocks lose 10% each: -$300
2 winning stocks make 50% each: +$1000
Total = $5700

Modern trading systems have completely automated stop-loss systems. This makes it so easy to set stop-losses that you have no excuses for losing big in a single trade anymore! In fact, you’re mad if you don’t take advantage of stop-losses. The only trick is setting them wisely. You’ll learn how to plan and time your entry and exit points on this site over the next few months.

Until then, good luck and keep on learning..


Deprecated: Function split() is deprecated in /home/stock/public_html/wp-includes/cache.php on line 215

Deprecated: Function split() is deprecated in /home/stock/public_html/wp-includes/cache.php on line 215